

I had this information stored in a Microsoft Loop… thing… that I keep forgetting exists. I had a need for it again, remembered it was there, extracted it, and now I’m putting it up here with bonus exposition. Yay.
While I’m sure there are many other uses that I’m not thinking of at the moment (because I don’t really think), remote debugging in PowerShell is one of those A-HA features that I didn’t realize I needed until I did it. It’s an indispensable tool when you’re creating text-based user interfaces (TUI) containing fixed elements combined with dynamic cursor positioning, and you want to be able to see how visual artifacts react without clobbering the session with the debugger.
PowerShell’s native command line interface (CLI) debugger is an extremely nice tool. Especially if your prior experience with shell debugging is set -x in Bash. Most people who spend anything more than a casual amount of time writing PowerShell in VSCode will interact with it, albeit through the visual interface.
Ya boi ain’t doing that.
It’s pretty, it’s familiar, and it’s an easy introduction to the debugger and debugging, but I take easy things and make them hard. Deal with it.
Considering casual usage, the CLI debugger has two major pitfalls:
- PowerShell command history will get peppered with whatever commands you’re typing into the debugger. This turns out to be a bit of a hassle if in your day-to-day usage you rely on the history. There are a few ways to work with this, but it’s a pain all the same. This is also beyond the scope of this article; I’m not going to explain how to use the CLI debugger (maybe in another article).
- In the off chance you happen to be working on a program where absolute positioned text in the buffer is required, the debugger doesn’t respect any of that and will clobber all the text it needs to. Nothing really to be done about this… except for remote debugging.
Under normal circumstances, in the same process, you’d set a breakpoint on an object (file, specific in-memory function, etc.), give some object-specific options, then run the object, and the debugger will kick in automatically if the breakpoint is encountered. No big surprises there. If we want to use another PowerShell process to examine yet another PowerShell process, it’s a little more involved.
Shown below is a single Kitty terminal window with three panes, each running their own PowerShell process. We’re not concerned with the pane on the right, rather we’re looking to use the two on the left. You can see that I’ve echoed the process ID (PID) for each session to illustrate (A) that they’re different processes and (B) to call out the different areas in the terminal window visually:

A normal workflow for me is to have my current code on the right, the program I’m writing, running, on the left, and, if necessary, a third process on the left-bottom to run as a debugger. Ergo, mapping this to the image above, I’m wanting to run my program in the PowerShell process 5535 and debug it with PowerShell process 5962. It should go without saying, but note that the PID for any given PowerShell process will not be the same each time you run PowerShell (this is true for any process in user space). You’ll want to get the PID before you try anything.
The next screenshot is the program I’m writing on the right running in the left-top pane.
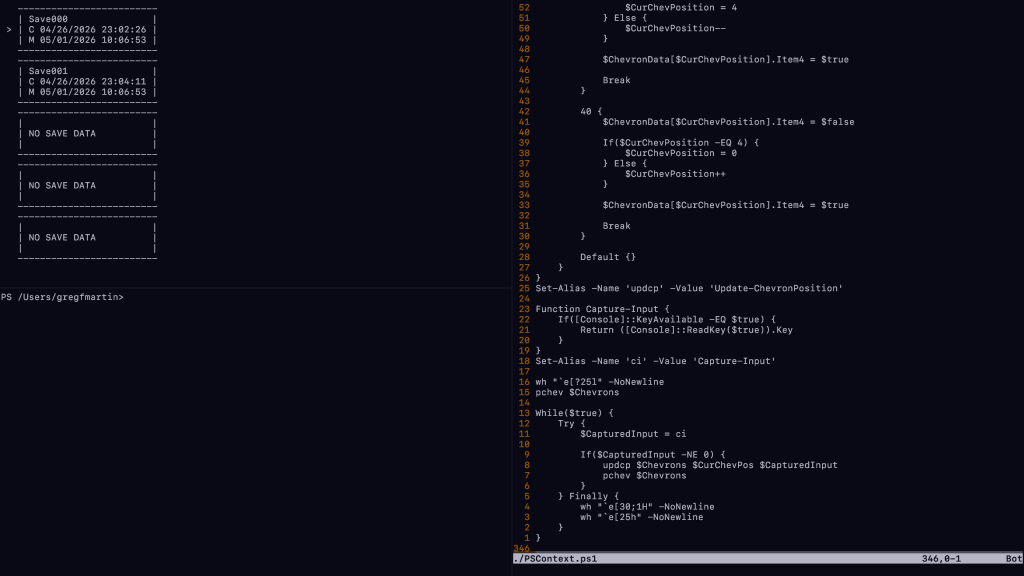
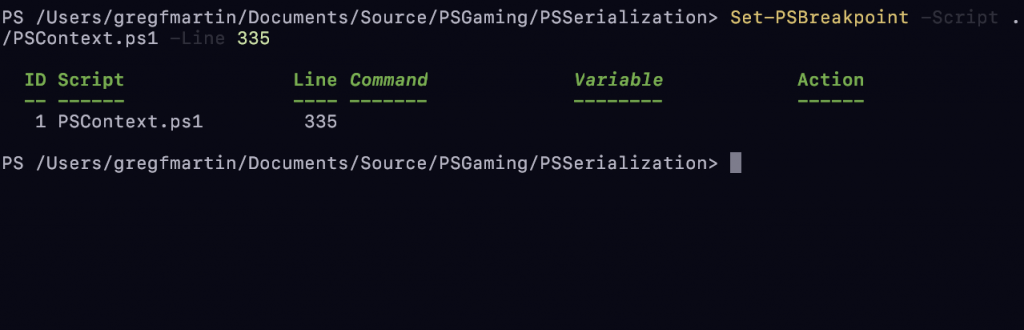
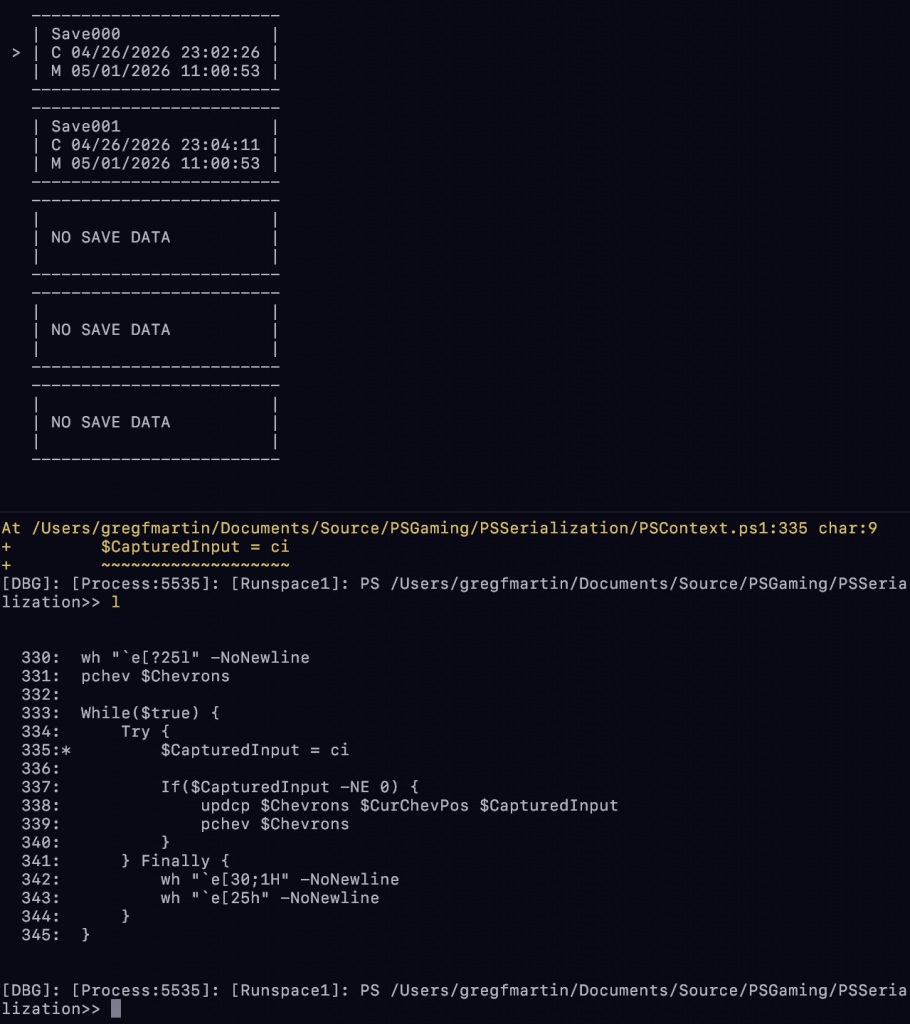
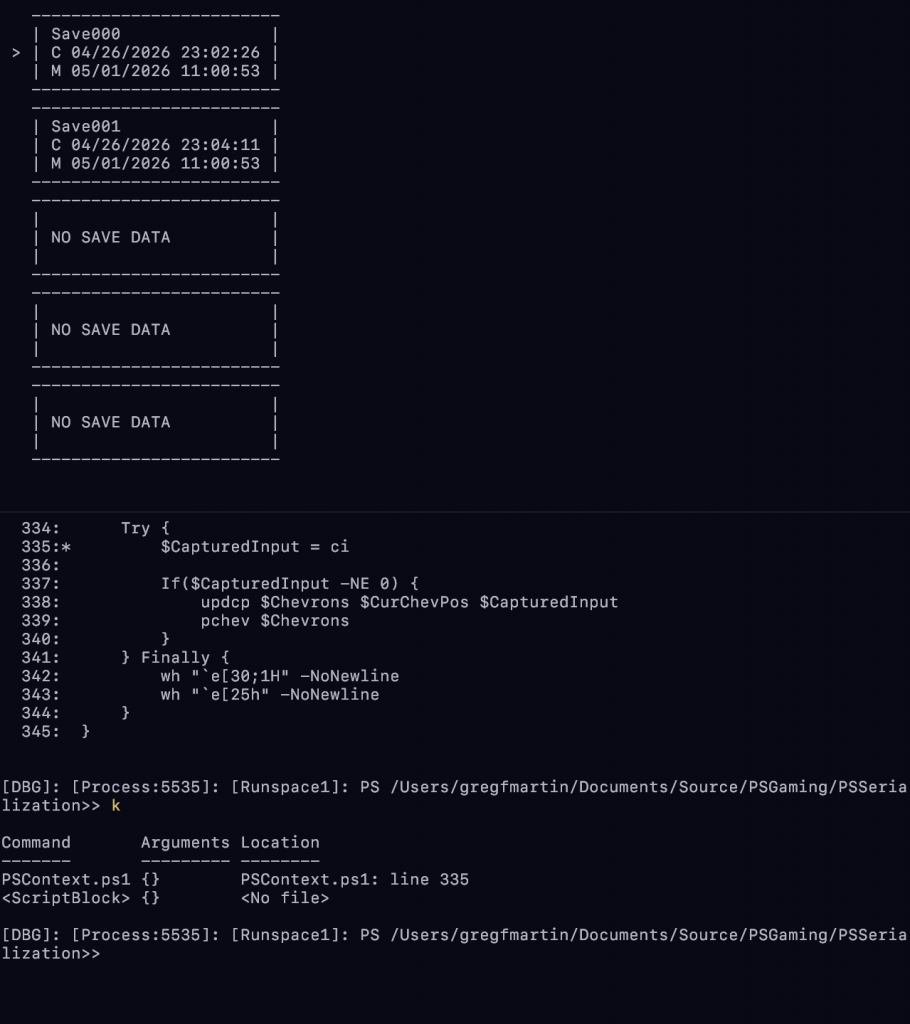
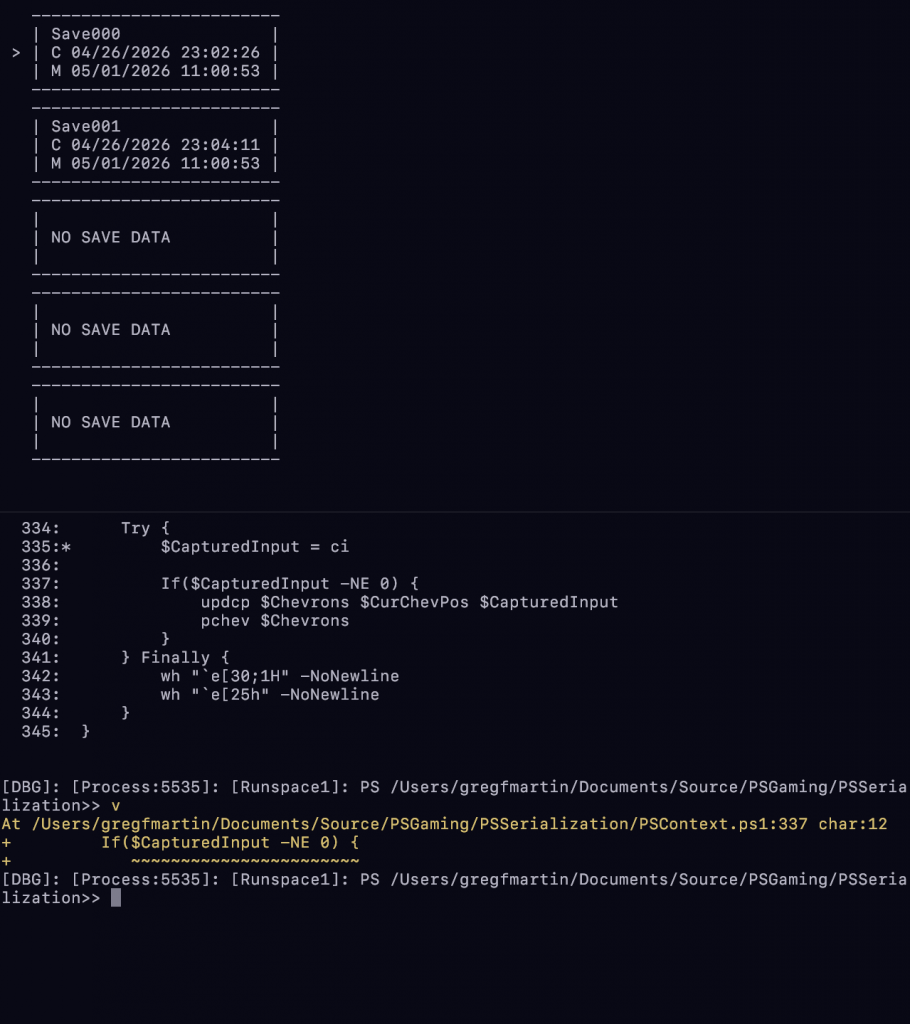
To illustrate some of what I’ve called out earlier, I’ll run the debugger in the same process as the program so you can see what it looks like. I’ll first set a breakpoint at a specific line, then run the program:
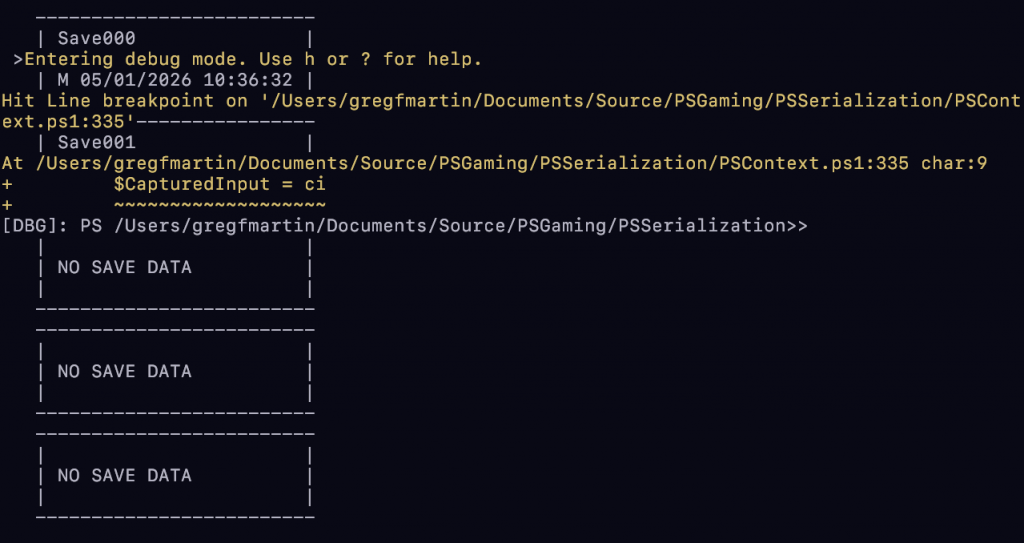
I could push the debugger a bit more, but you should hopefully get the… picture… by now. This isn’t ideal.
Remote debugging is going to take advantage of some more advanced features of PowerShell, so I’ll make them as easy to follow along with as possible. A summary of the process is as follows:
- Connect to the remote PowerShell process (you need its PID for this).
- Enable debugging on the default Runspace of the remote PowerShell process.
- Set a breakpoint on the target, explicitly calling out the default Runspace.
- Start the Runspace Debugger.
- Back in the target remote PowerShell process, run the program you want to debug.
If done correctly, once the debugger in the remote PowerShell process encounters the breakpoint you set, you should see it firing off in the peered PowerShell process.
A lot of words, a lot of drool. Let’s see it in action.
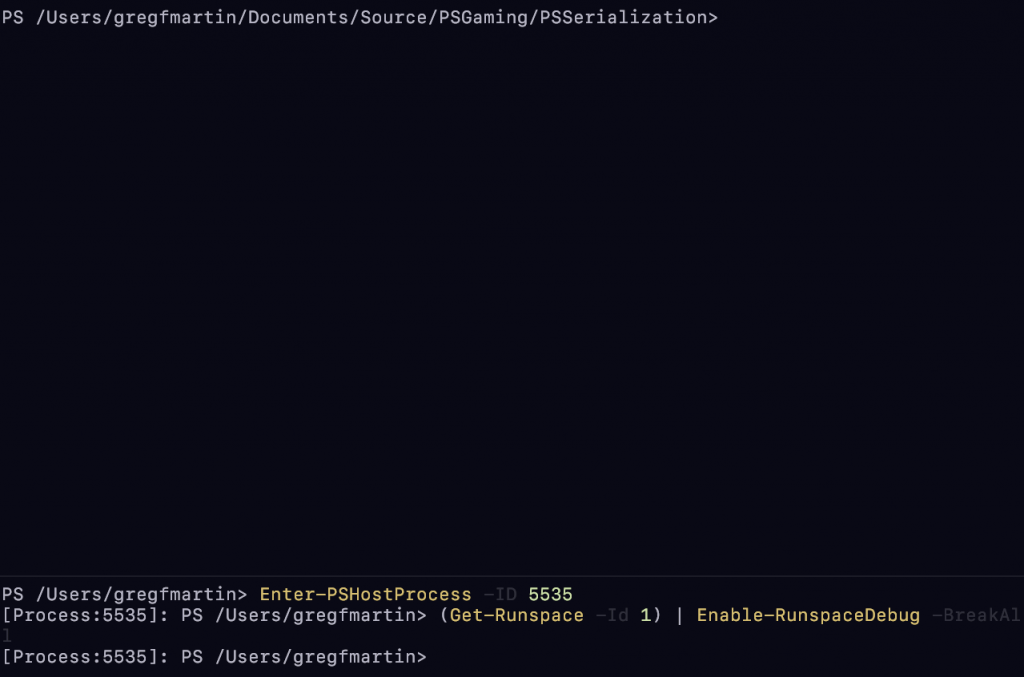
As stated earlier, the program is going to be running in the PowerShell process 5535, and we’re going to debug it from 5962. Thus, from 5962, we’re going to run the following command:
Enter-PSHostProcess -ID 5535

Our prompt on 5962 looks a wee bit different!
Next, we enable debugging on the default Runspace in the remote process. AFAIK, PowerShell will always enumerate Runspaces with a 1-index, so the default should always be 1. I’m sure someone smarter than me is going to point out that isn’t always the case, and maybe it isn’t, but we’re not mad hacking at this point. I’m going to run the following command on the 5962 process after establishing the remote connection:
(Get-Runspace -Id 1) | Enable-RunspaceDebug -BreakAll
Now, if you’ve noticed, the remote connection into 5535 has dumped me into my home directory. I’m going to change to where my program is located at:
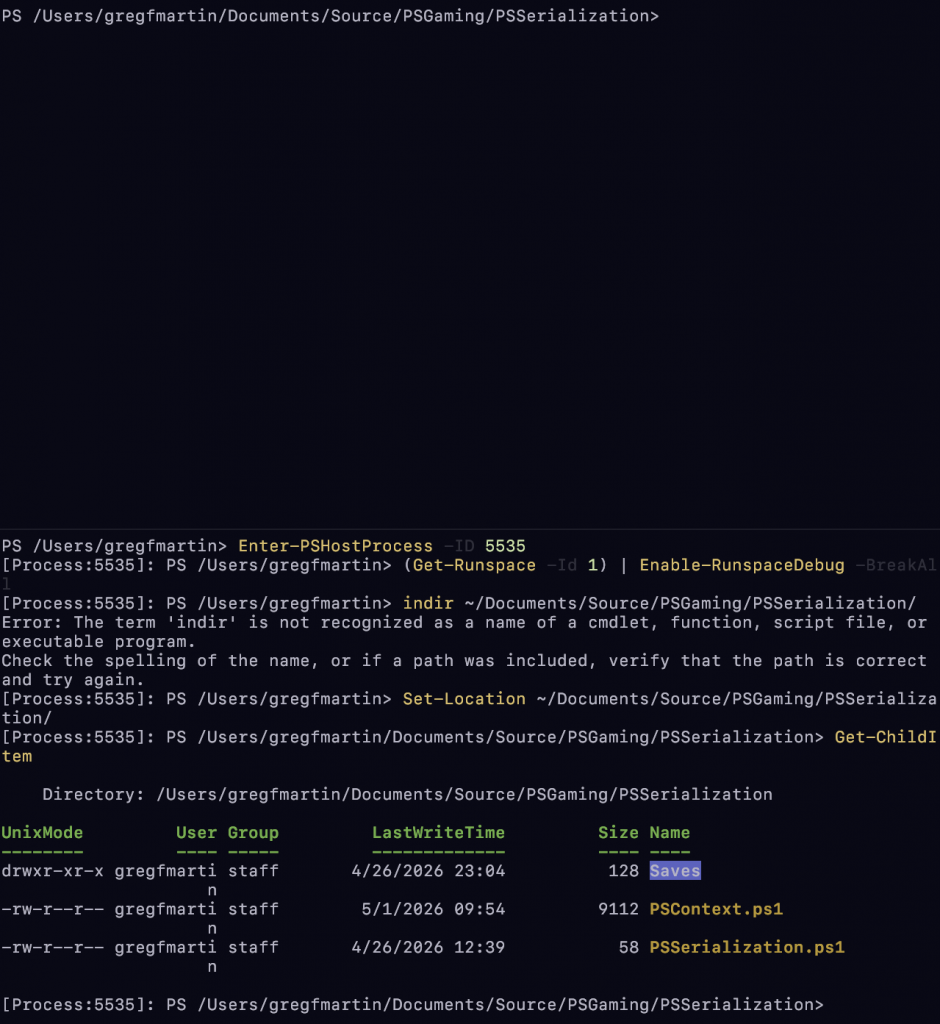
Because I’m super smart, I forgot that this doesn’t load user profiles. Hence why indir doesn’t exist. Go team!
Now we set a breakpoint on the script, also explicitly specifying the Runspace the debugger should examine for this breakpoint:
Set-PSBreakpoint -Script [FILE] -Line [LINE-NUMBER] -Runspace (Get-Runspace -Id 1)
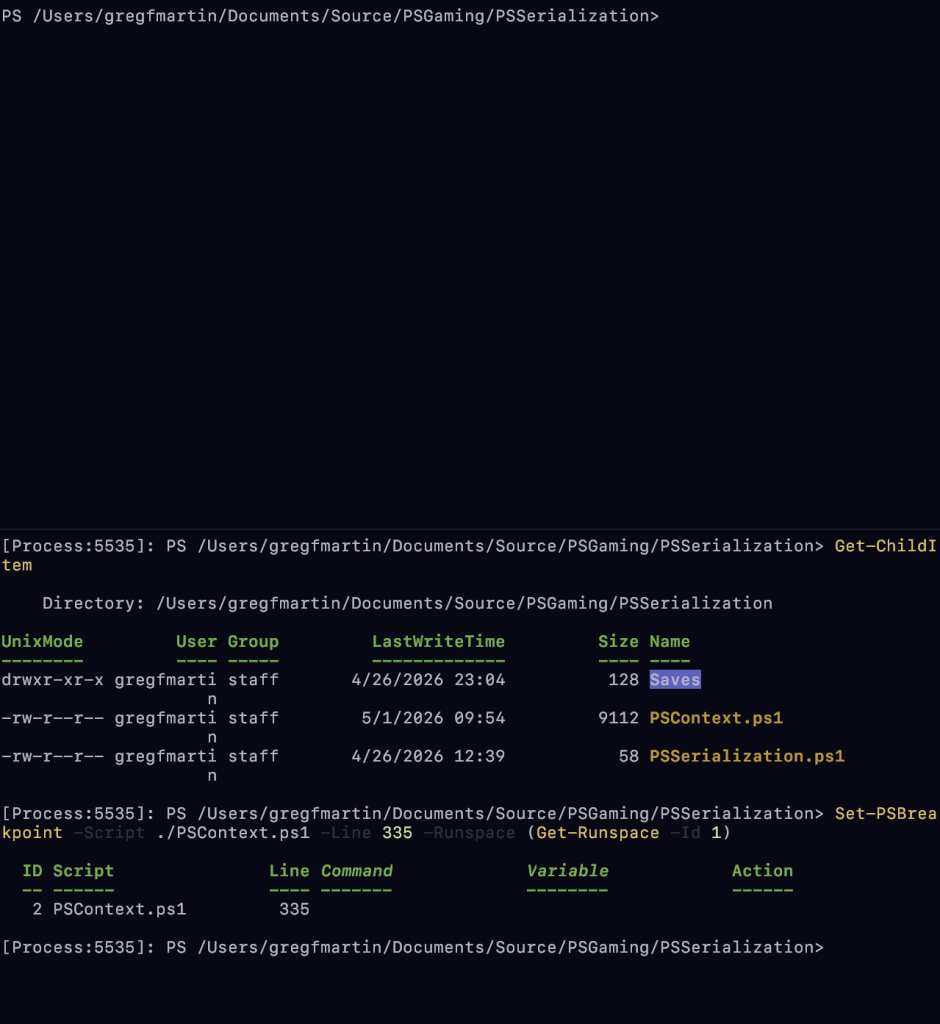
Next, we start the debugger on the Runspace:
Debug-Runspace -Id 1
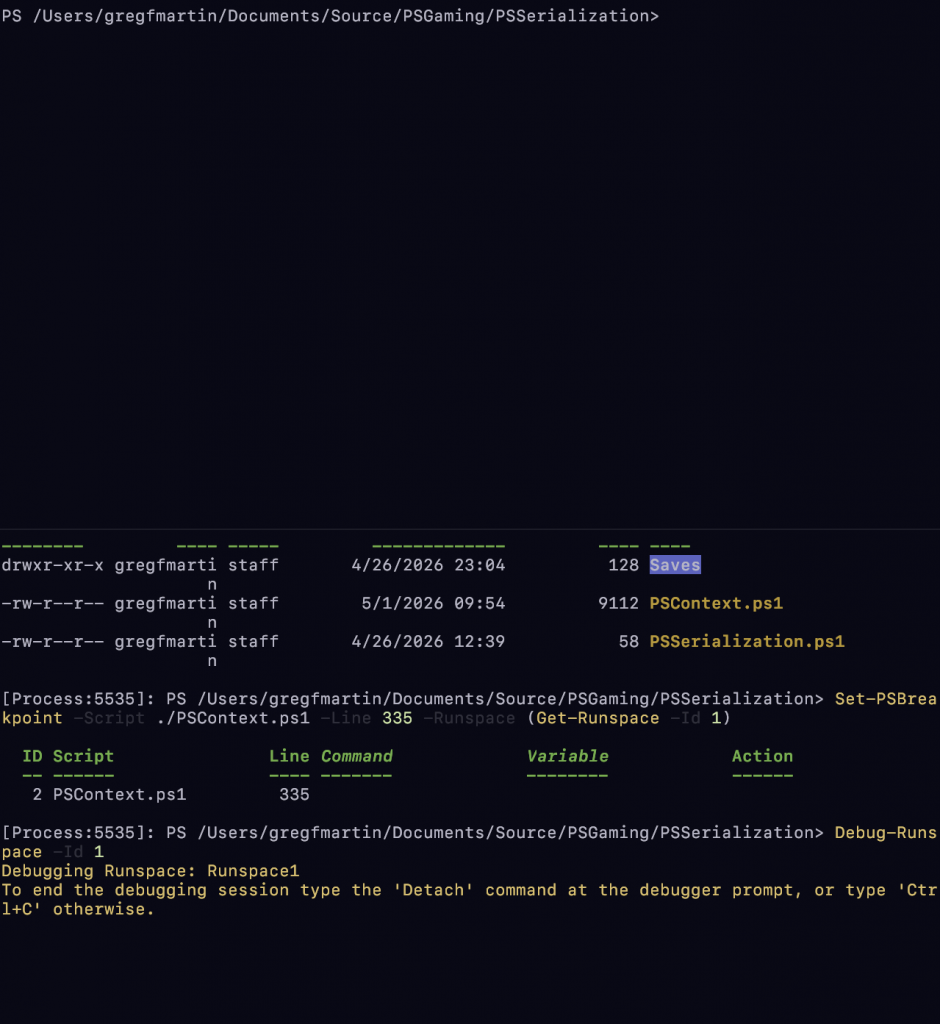
At this point, the debugger is attached on the remote PowerShell process (5535) from PowerShell process 5962. Finally, we go back to our “remote” process and start the program. In this case, the breakpoint is in a very accessible spot, so we should see the program halt and the debugger spitting information out immediately:
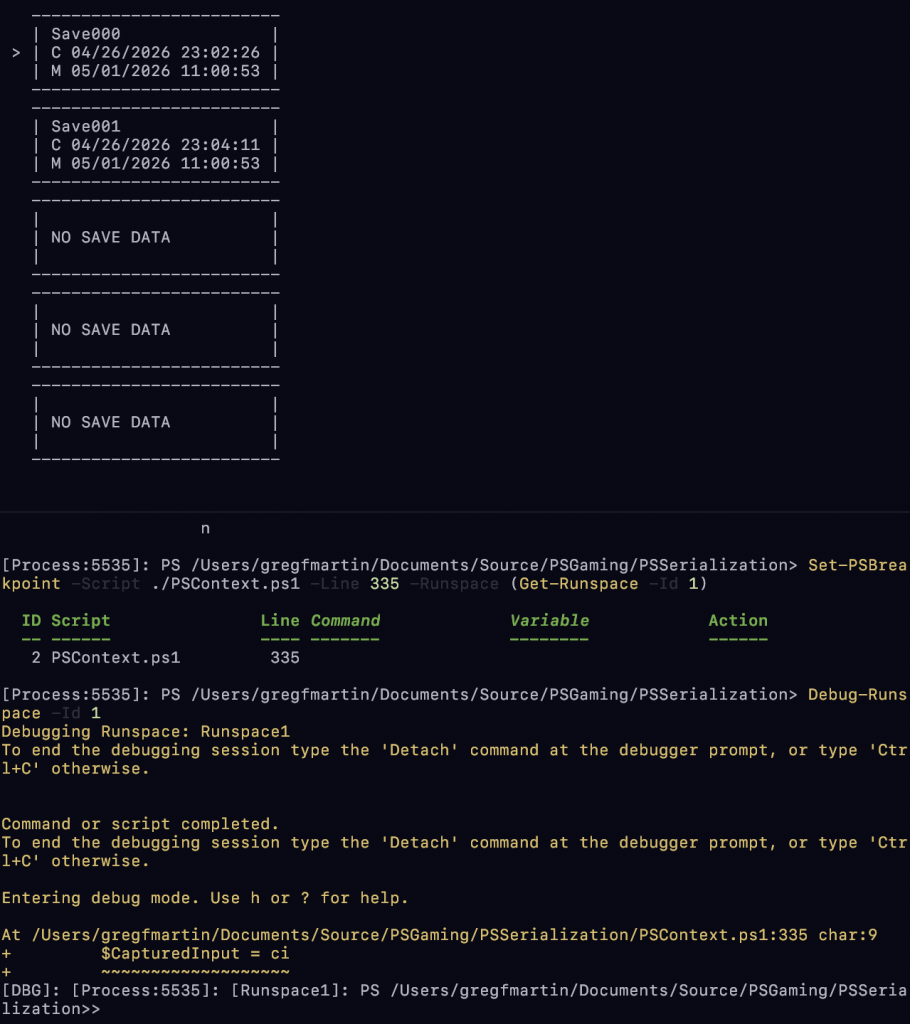
There’s a lot of text here, but if you read near the prompt on the left-bottom pane, you can see the debugger has halted the program at line 335, which is where we set the breakpoint at above. Try to ignore the text that says Command or script completed. It looks confusing and could throw you off, but I promise you that the debugger has halted your program and owns its flow. Now, we can use the debugger in a remote process just as we would in a single process, and get the benefit of not muddying up the process we want to see the program in:
When we’re done, you detach the remote debugger with Ctrl+C, then leave the remote process with the exit command:
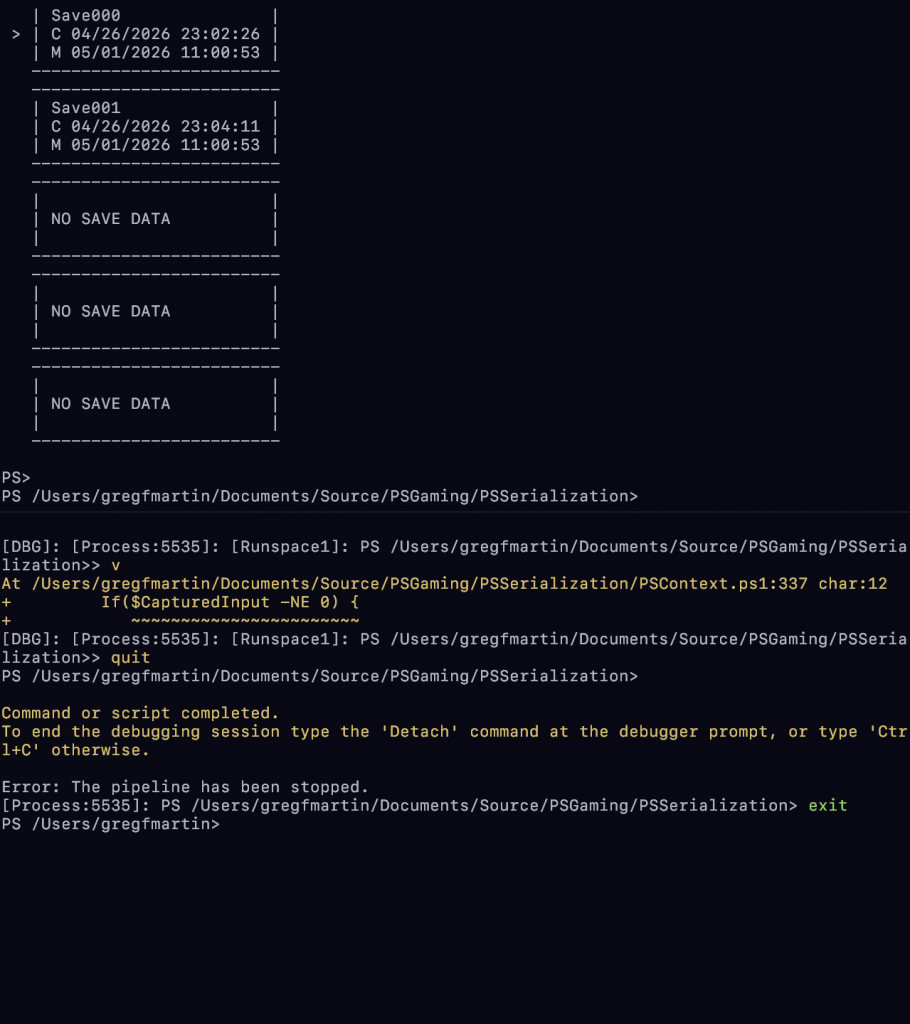
Notice too that this will terminate the program running in the remote process.
That’s all there is to remote debugging. A pretty neat feature for the adventurous.
Leave a Reply